Titration Curve Graphs for SECTION L1
Locate your Group and Locker numer in
the table below.
Click on your locker number to see your three graphs.
Print your three graphs full-page.
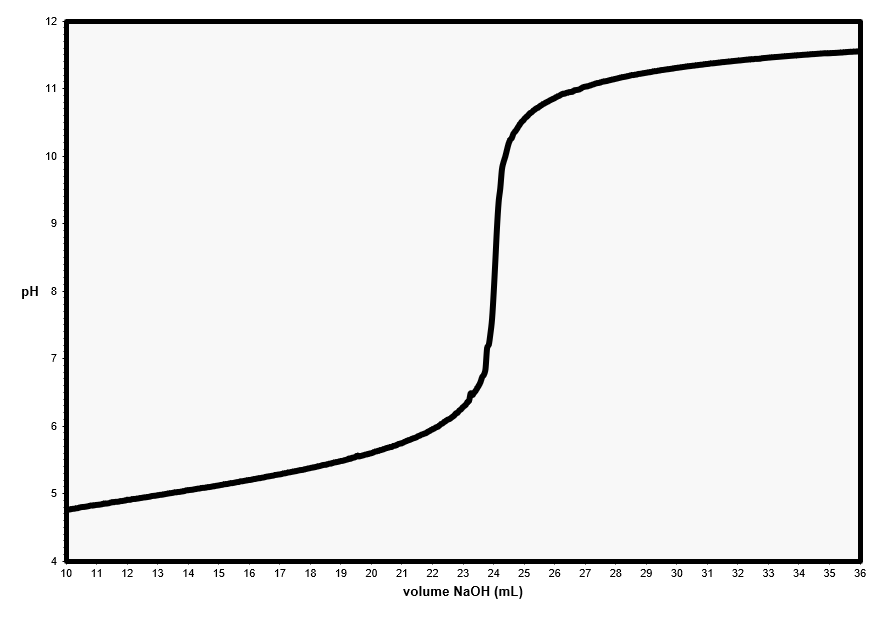
Perform all the various graphical determinations directly on your graphs, as shown in the Chem 111 lab manual, and discussed in the PreLab Talk video.
Section L1 use NaOH = 0.1005 M in your calculations.
Click on your locker number to see your three graphs.
Print your three graphs full-page.
Perform all the various graphical determinations directly on your graphs, as shown in the Chem 111 lab manual, and discussed in the PreLab Talk video.
Section L1 use NaOH = 0.1005 M in your calculations.