Chem 101 Online Exp: Alcohol Density
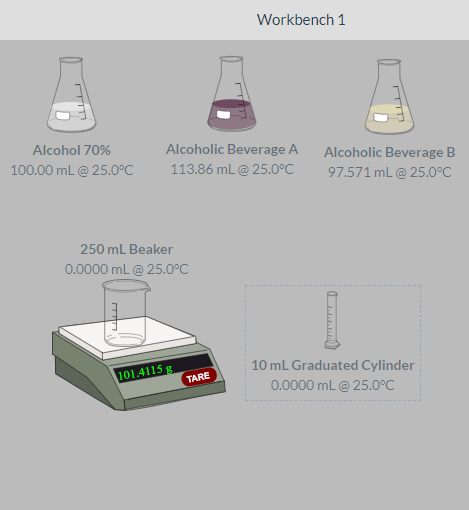
In this online experiment, the density of water, two alcoholic beverages, and 70% (v/v) pure ethanol will be measured using Virtual Lab software. Students will then prepare a graph of "percent alcohol versus density" using either MS-Excel or Google Sheets. The trendline will be obtained and the equation of the line will be used to calculate the percent alcohol present in the two beverages.
In this online experiment, students will learn how to create a graph and how to programme a simple formula into MS-Excel or Google Sheets. Although Google Sheets currently requires more effort than MS-Excel for this particular experiment, students are free to choose which software they use.
The "lab manual" for this experiment can be obtained here by clicking on the link below. Your instructor may have already given you a paper copy in a previous in-lab session. Please read through that material first.
Alcohol Density Lab Manual:
Lab Report Sheet
The lab report sheet can be completed either in electronic or paper-hardcopy format. Please follow your lab instructor's own preference.
A paper hardcopy of this report sheet may have already been given to you during a previous in-lab session at Capilano University. It is also available for printing at home using this link:
Paper Format:
An electronic version of the report sheet is available as a PDF form and is accessed using this link:
Electronic Format:
If using the electronic format, be advised that it is easier to use on a computer verus a mobile device. An app will be required to fill a PDF form on a mobile device.
The free app PDFelement is demonstrated here and may be downloaded for either Apple or Android devices. If using the electronic format, fill out all shaded cells and save your work regularly to prevent accidental loss.
Virtual Lab
The online Virtual Lab is free to access, courtesy of Carnegie-Mellon University, and hosted at the Chem Collective, funded by the National Science Foundation. When you are ready to measure the density of the four liquids, click on the link below to access the Alcohol Density module. A short video demonstrating the software is available just below the link. You should probably watch that demo video first.
Link to module: http://chemcollective.org/activities/vlab/76
Virtual Lab Demo Video (6:23)
Mouse-over video to set HD quality and view in full-screen
Once you have collected your mass measurements for the four liquids, you will need to create and print a graph and then perform the necessary calculations. The two videos below demonstrate how to do this using both MS-Excel and Google Sheets.
MS-Excel Software
If you do not have MS-Excel at home, note that all CapU students have access to MS-Office 365 apps, as described by clicking on the link or icon below. All on-campus computers are also equipped with Excel.
link to Office 365 apps for CapU
MS-Excel Graphing and Calculations Demo Video (12:34)
Mouse-over video to set HD quality and view in full-screen
LINK to optional video on making visual tweaks to an Excel Graph (4:48).
Google Sheets Graphing and Calculations Demo Video (11:07)
Mouse-over video to set HD quality and view in full-screen
Calculations
Please refer to the lab manual handout and the lab report sheet.
Submission of Completed Lab Report
The report consists of the report sheet and the graph. Please have these two items stapled together prior to handing them in.
Please submit your completed lab report in the manner and time specified by your lab instructor. This could require handing in the paper report sheet in person at your next in-lab session at Capilano University, or submitting it in person at the drop-box in the hallway outside of the lab room by a certain deadline. For the electronic format, you could be requested to submit via email or Moodle or the eLearn website.
If unsure, please email your lab instructor for guidance.
There is no quiz.