Chem 110 / 154 Online Exp: Arsenic Toxic Levels
In this online experiment, there has been an accidental release of arsenic at a mine located by a river. The arsenic level present at the mine and at three sites downstream from the mine must be determined. Any level above 0.01 mg / L is unsafe for humans to drink from. Students will use the Virtual Lab software to perform gravimetric analysis on their water samples. A graph of "distance from mine versus arsenic level" will be prepared using either MS-Excel or Google Sheets. The trendline will be obtained and the equation of the line will be used to perform subsequent calculations.
In this online experiment, students will learn how to create a graph and how to programme a simple formula into MS-Excel or Google Sheets. Although Google Sheets currently requires more effort than MS-Excel for this particular experiment, students are free to choose which software they use.
This online lab will require approximately 2 hours to complete.
The "lab manual" for this experiment can be obtained here by clicking on the link below. Your instructor may have already given you a paper copy in a previous in-lab session. Please read through that material first.
Aresenic Toxic Levels Lab Manual:
Lab Report Sheet
The lab report sheet can be completed either in electronic or paper-hardcopy format. Please follow your lab instructor's own preference.
A paper hardcopy of this report sheet may have already been given to you during a previous in-lab session at Capilano University. It is also available for printing at home using this link:
Paper Format:
An electronic version of the report sheet is available as a PDF form and is accessed using this link:
Electronic Format:
If using the electronic format, be advised that it is easier to use on a computer verus a mobile device. An app will be required to fill a PDF form on a mobile device.
The free app PDFelement is demonstrated here and may be downloaded for either Apple or Android devices. If using the electronic format, fill out all shaded cells and save your work regularly to prevent accidental loss.
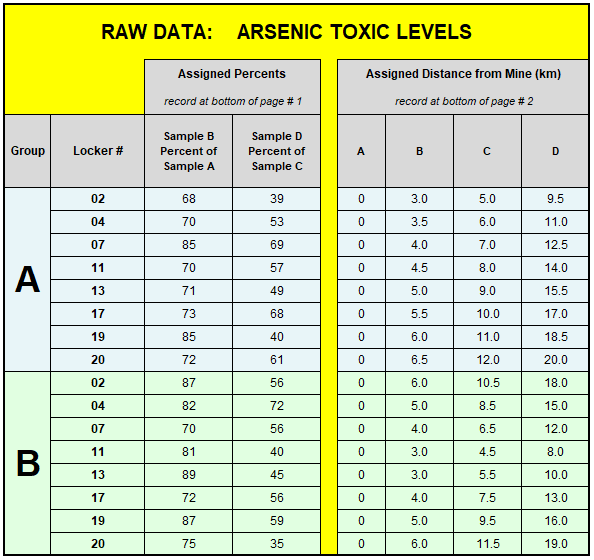
Raw Data
Some of your raw data will be collected in the Virtual Lab programme, but some additional data is provided below. There are 16 unique sets of raw data. It does not matter which section you are in. Find your locker number below, in group A or B, and record your two percents and distances onto the lab report sheet. You will not need this data until after completing the Virtual Lab portion of the experiment.
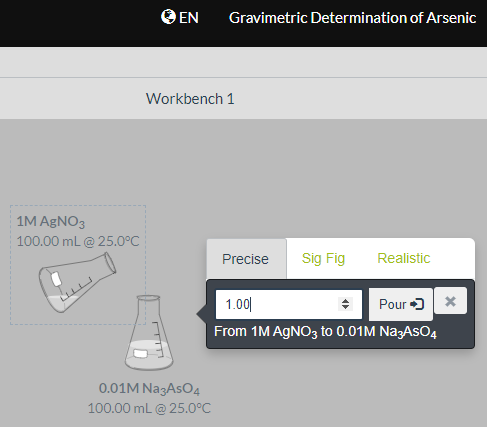
Virtual Lab
The online Virtual Lab is free to access, courtesy of Carnegie-Mellon University, and hosted at the Chem Collective, funded by the National Science Foundation. When you are ready to conduct the experiment, click on the link below to access the module. A short video demonstrating the software is available just below the link. You should probably watch that demo video first.
Link to module: http://chemcollective.org/activities/vlab/75
When using the software, be sure to always tip the flask of silver nitrate into the other flasks, and not the reverse. The flasks are all labeled.
Virtual Lab Demo Video (6:15)
(at 1:27, the precipitate is "silver arsenate" not "silver nitrite".)
Mouse-over video to set HD quality and view in full-screen
Once you have collected your mass measurements for the two samples, you will need to proceed as directed in the lab manual. You will eventually create and print a graph and then perform the necessary calculations. The two videos below demonstrate how to do this using both MS-Excel and Google Sheets.
MS-Excel Software
If you do not have MS-Excel at home, note that all CapU students have access to MS-Office 365 apps, as described by clicking on the link or icon below. All on-campus computers are also equipped with Excel.
link to Office 365 apps for CapU
MS-Excel Graphing and Calculations Demo Video (20:07)
The first portion of this video (up to 13:42) shows how to create, modify, and print a graph with a trendline and equation for the trendline. From 13:42 onwards, programming of various Excel functions and how to use Excel for calculations is demonstrated. These last 7 minutes are purely optional and may be omitted.
Mouse-over video to set HD quality and view in full-screen
Google Sheets Graphing and Calculations Demo Video (15:44)
The first portion of this video (up to 12:40) shows how to create, modify, and print a graph with a trendline and equation for the trendline. From 12:40 onwards, programming of various Sheets functions and how to use Sheets for calculations is demonstrated. These last 3 minutes are purely optional and may be omitted.
Mouse-over video to set HD quality and view in full-screen
Calculations
Please refer to the lab manual handout and the lab report sheet.
Submission of Completed Lab Report
The report consists of the report sheet and the graph. Please have these two items stapled together prior to handing them in.
Please submit your completed lab report in the manner and time specified by your lab instructor. This could require handing in the paper report sheet in person at your next in-lab session at Capilano University, or submitting it in person at the drop-box in the hallway outside of the lab room by a certain deadline. For the electronic format, you could be requested to submit via email or Moodle or the eLearn website.
If unsure, please email your lab instructor for guidance.
There is no quiz.